What is LabVIEW and How to make basic Electrical Projects in LabVIEW?
Introduction to LabVIEW and Basic LabVIEW Based Electrical Projects
As a proven useful tool for prototyping, the LabVIEW graphical development platform delivers a numerous solutions to a wide variety of applications such as instrumentation control, embedded monitoring and control systems, data acquiring and processing, automation test and validation systems, etc.
LabVIEW includes hundreds prewritten libraries which help to create flexible and scalable systems from functional embedded systems to high performance test and measurement systems.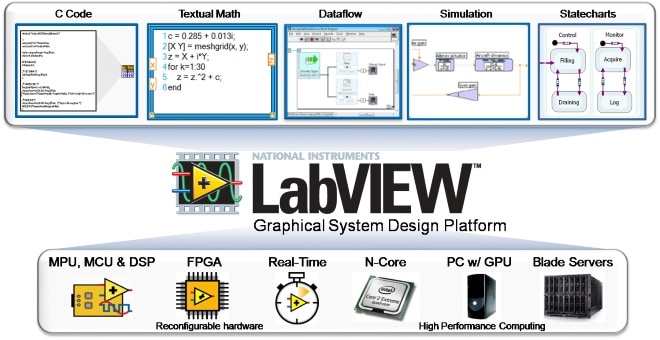
What is LabVIEW?
LabVIEW stands for Laboratory Virtual Instrument Engineering Workbench and is developed by National Instruments. It is a powerful programming tool that gives software solutions for scientific and engineering systems. LabVIEW is a graphical programming language in which data flow determines the execution of program, in contrast to text based programming language where instruction (lines of text) determines the program execution.
LabVIEW allows one to build a user interface which is known as front panel using a set of tools and objects. And then allows user to add code on block diagram using graphical representation of the functions. So the code on the block diagram control the front panel objects depending on the control structure implemented. Thus, the user can build custom data acquisition, test, measurement, and control solutions for a variety of application needs.
LabVIEW is integrated for communicating with various data acquisition devices such as GPIB, PXI, VXI, RS-232, RS-485 and USB based devices. And also offers internet of things using LabVEW web server and software standards like TCP/IP and ActiveX.
Virtual Instruments
The programs in the LabVIEW are called virtual instruments or simply VIs, because the operation and appearance of the programs resemble the physical instruments such as multimeters and oscilloscopes.
A VI consists three components, namely, front panel, block diagram and icon & connector pane. The front panel consists of controls and indicators which serve as a user interface, and the block diagram contains the source code for the VI. The Icon and connector pane is a visual representation of the VI consisting of input and outputs. This Icon and connector pane allows the VI to be used in another VI as a subVI (a VI within another VI is called subVI).
Front Panel:
The figure below shows the front panel of a VI consisting of various controls and indicators. It serves as the user interface of the VI so that interactive input and output terminals can be developed for an application. Controls in LabVIEW include knobs, dials, push buttons, numeric controls, and Boolean switches. Controls acts as input devices which passes the data to the block diagram.
Indicators are output terminals of a VI, which displays the output value. Some of indicators include numeric indicators, gauge, LEDs, graphs and other displays. Indicators act as output devices which acquires the data from the block diagram and displays it.
Both controls and indicators can be selected from control palette which is available only on the front panel. By a right-click anywhere on front panel, control panel will be appeared.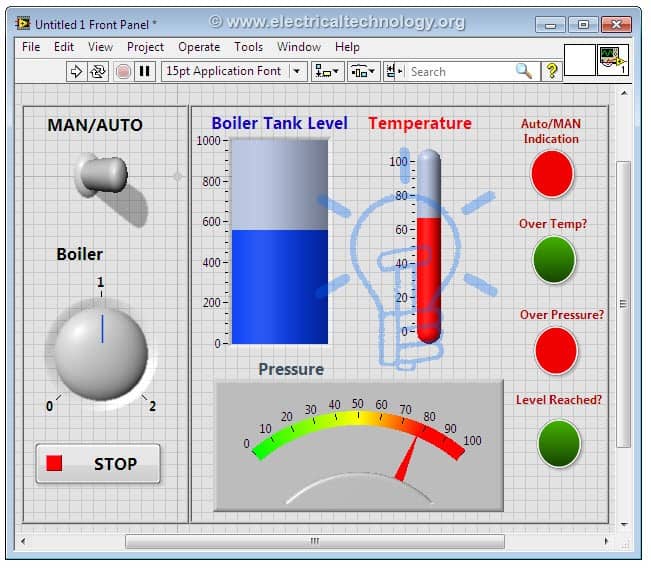
Block Diagram
The figure below shows the block diagram which accompanies the above front panel. It contains the graphical source code for the VI using graphical representations of functions to control front panel objects. The block diagram consists of front panel objects as terminals and additionally various functions (such as numeric, Boolean, compare, array, timing, etc.) and structures (such as while loop, for loop, case structure, etc.).
Every indicator or control on the front panel consists of corresponding terminal on the block diagram. So these are wired with various functions in order to implement a control application.
These functions and structures can be selected from function palette which is available only on the block diagram. By right-click anywhere on the block diagram workspace, function palette will be appeared.
In the above block diagram, the outer rectangular structure represents a while loop and the inner one is the case structure. The orange, blue and green lines indicate the wires which passes the data from controls to indicators. These objects and structures on the block diagram represent the code for the VI.
This VI can be executed, paused or stopped by pressing various buttons (such as arrow or run button, pause and stop buttons) located in the palette along the top of the window.
LabVIEW Projects
LabVIEW is an ideal platform for prototyping, designing and developing of several projects related to a wide variety of domains including electrical, mechanical, signal processing, electronics, instrumentation and control, biomedical and aerospace.
LabVIEW offers flexibility to design solutions to various projects at minimal time and effort due to the advantage of graphical coding and advanced function blocks. The following are some of the LabVIEW based projects related to the electrical domain.
Thermal Overload Relay Using LabVIEW
The objective of this project is to monitor and control the operation of an electric machine against thermal overload using LabVIEW and DAQ module. Here in the given VI DAQ input and outputs are eliminated for ease of understanding to the reader and hence, only simulation model is developed.
The above figure shows the front panel of thermal overload relay VI on which left hand side elements are called as controls and right hand side elements are called as indicators.
This front panel displays the various parameters values and ambient temperature of the machine. It gives the relay trip indication once the temperature exceeds the safe limit (ambient temperature of the machine). The tripping of the relay for exceeding ambient temperature is shown in below figure.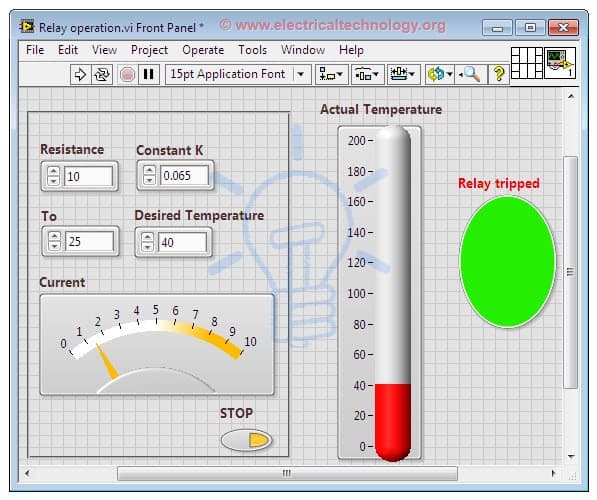
The graphical code for this VI is implemented on the block diagram as shown in below. The block diagram represents the actual implementation of the project. Here the temperature rise is calculated based on the temperature constant(degree centigrade per kilowatt) of the machine.
So the temperature comparison has been made on the block diagram to compare actual and desired (set limit for a safe value) temperatures. It is also possible to implement this code using current and temperature sensors along with DAQ module to have real time control of the machine.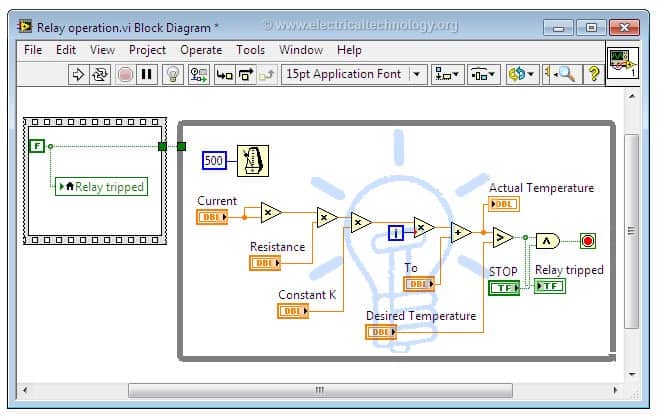
Load Characteristics of a Self-excited DC shunt Generator in LabVIEW
It is one of the basic electrical projects under virtual electrical machine laboratory which deals with machine characteristics when it is loaded. The figure below shows the front panel of the VI consisting of controls, indicator and waveform chart.
The terminal voltage, field current and load current (including armature and field resistances) are acting as inputs or controls and from this data, armature current, armature drop and induced voltage in the generator are calculated and displayed in the graph as well as numerical indicators as shown in below figure.
The source code for this VI is shown in the bock diagram below in which various mathematical functions determines the output parameters based on the input parameters. In the block diagram, an array of data values (represented with thick orange lines) is passed to the different mathematical functions. These functions determine the appropriate array of results which are then passed to the graph and array indicators.
Simulation of RLC Series Circuitin LabVIEW
This project implements RLC series circuit and determines its resonance condition using LabVIEW software. RLC series circuits are used in tuning circuits such as oscillator circuits, filter circuits, radio and television tuning circuits.
In RLC series circuit, the frequency at which the inductive reactance is equal to the capacitive reactance is called as resonant frequency. At the resonant frequency, the inductive reactance and capacitive reactance will cancel each other which make the impedance become equal to resistance and hence the current will be a maximum value.
This statement is proved with LabVIEW project given below. The front panel has controls and indicators which are responsible for data inputting and data acquiring.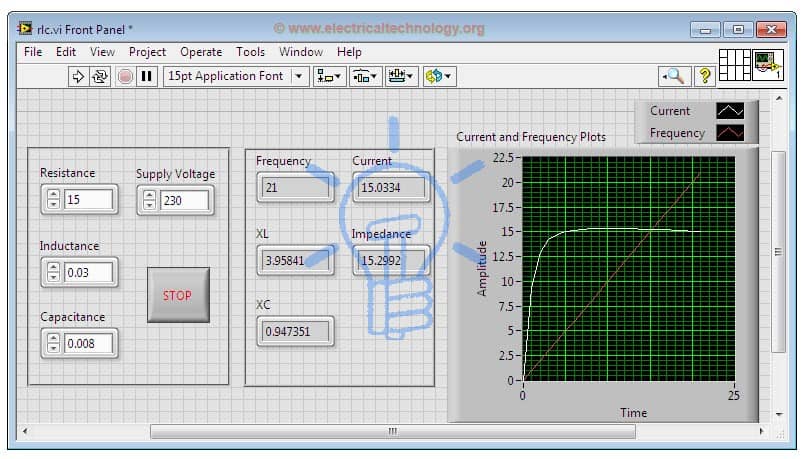
The figure below gives the graphical code for the series RLC circuit on the block diagram. By performing the mathematical operations to the given inputs (inductance, capacitance, and voltage), parameters like inductive reactance, capacitive reactance, impedance and current are determined in the block diagram. You may also read:
- What is Arduino and How to Program it?
- How To Design a PCB (Step by Step & Pictorial Views)
- How to Program PIC18 Microcontroller in C. Step by Step Tutorial
- Must have iOS App for Electrical Engineer
- 15+ Must have Android Apps for Electrical Engineer/Students
- 10+ Design & Simulation Tools for Electrical/Electronics Engineers Online


This web is very useful for electrical engineer
Thanks for the information about arduino lab view basic .. Really helpful blog .. thanks
Thanks! This is useful tutorial to get started with LabView.
is there any steps in how to do these simulations
Thanks for your lecture.
Will the tuning of gain for PID controller depend on the Set point or not?
Thanks a gain